Normal Distribution
normal distribution statistics
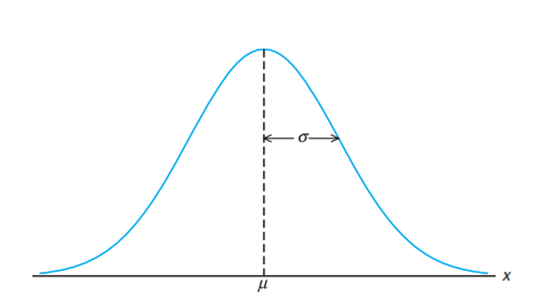
The most important continuous probability distribution in the field of statistics is the normal distribution, also known as the Gaussian distribution, in honor of Karl Friedrich Gauss (1777–1855), who derived the equation from a study of errors in repeated measurements of the same quantity. Figure 1 shows a bell-shaped distribution, commonly referred to as the normal distribution curve.
Normal distribution plays a central role in statistical theory and practice, as it describes many natural phenomena and forms the basis for numerous statistical methods. The curve is symmetric around the mean, with its shape determined by the standard deviation. The larger the standard deviation, the flatter and wider the curve; conversely, the smaller the standard deviation, the steeper and narrower the curve.
One of the key properties of the normal distribution is the empirical rule, which states that approximately 68% of the data falls within one standard deviation of the mean, 95% within two standard deviations, and 99.7% within three standard deviations. This property makes the normal distribution extremely useful for understanding variability and making predictions.
This distribution has a probability density function (PDF) given by the formula,
Where is the mean dan is the standard deviation. This function describes the likelihood of a random variable taking on a particular value.
This equation is derived from the Gaussian Integral. Click here for detailed Gaussian Integral derivation.